7 Chance Samuel
-
- Year:
- 2
-
- Hometown:
- Douglasville, Georgia
-
- Position:
- Guard
-
- Major:
- University Transfer
-
- gp
- 20
-
- pts/g
- 12.3
-
- fg %
- 36.7
-
- 3pt %
- 28.9
-
- ft %
- 80.3
-
- reb/g
- 4.9
-
- a/g
- 2.5
Recent Games
| Total | Conference | |
|---|---|---|
| Games | 20 | 20 |
| Games started | 20 | 20 |
| Minutes | 593 | 593 |
| Minutes per game | 29.6 | 29.6 |
| FG | 87-237 | 87-237 |
| FG Pct | 36.7 | 36.7 |
| 3PT | 22-76 | 22-76 |
| 3PT Pct | 28.9 | 28.9 |
| FT | 49-61 | 49-61 |
| FT Pct | 80.3 | 80.3 |
| Off rebounds | 34 | 34 |
| Def rebounds | 64 | 64 |
| Total rebounds | 98 | 98 |
| Rebounds per game | 4.9 | 4.9 |
| Personal fouls | 50 | 50 |
| Disqualifications | 2 | 2 |
| Assists | 49 | 49 |
| Turnovers | 37 | 37 |
| Assist to turnover ratio | 1.3 | 1.3 |
| Steals | 31 | 31 |
| Blocks | 3 | 3 |
| Points | 245 | 245 |
| Points per game | 12.3 | 12.3 |
| Points per 40 min | 16.5 | 16.5 |
Game Log - Shooting
| Date | Opponent | Score | gs | min | fg | pct | 3pt | pct | ft | pct | pts |
|---|---|---|---|---|---|---|---|---|---|---|---|
| Sep 29 | Red Deer Polytechnic | L, 96-91 | - | - | - | - | - | - | - | - | - |
| Sep 30 | Red Deer Polytechnic | L, 102-89 | - | - | - | - | - | - | - | - | - |
| Oct 5 | Briercrest College | W, 87-77 | - | - | - | - | - | - | - | - | - |
| Oct 6 | Briercrest College | W, 75-72 | - | - | - | - | - | - | - | - | - |
| Oct 13 | Concordia University of Edmonton | L, 82-63 | 1 | 35 | 5-21 | 23.8 | 2-10 | 20.0 | 5-5 | 100.0 | 17 |
| Oct 14 | at Concordia University of Edmonton | L, 98-87 | 1 | 28 | 3-10 | 30.0 | 1-2 | 50.0 | 4-4 | 100.0 | 11 |
| Oct 27 | at The King's University | W, 85-77 | 1 | 25 | 2-7 | 28.6 | 0-1 | 0.0 | 3-4 | 75.0 | 7 |
| Oct 28 | The King's University | W, 87-80 | 1 | 24 | 3-9 | 33.3 | 0-1 | 0.0 | 5-6 | 83.3 | 11 |
| Nov 3 | Briercrest College | W, 91-88 | 1 | 38 | 7-17 | 41.2 | 2-5 | 40.0 | 3-3 | 100.0 | 19 |
| Nov 4 | Medicine Hat College | W, 95-93 | 1 | 33 | 6-13 | 46.2 | 1-4 | 25.0 | 5-6 | 83.3 | 18 |
| Nov 10 | University of Alberta-Augustana | W, 86-67 | 1 | 23 | 2-11 | 18.2 | 0-2 | 0.0 | 2-2 | 100.0 | 6 |
| Nov 17 | at Lethbridge College | W, 97-78 | 1 | 24 | 4-10 | 40.0 | 1-4 | 25.0 | 5-7 | 71.4 | 14 |
| Nov 18 | at Ambrose University | W, 92-70 | 1 | 26 | 6-13 | 46.2 | 2-6 | 33.3 | 2-2 | 100.0 | 16 |
| Nov 24 | NAIT | W, 91-65 | 1 | 32 | 3-9 | 33.3 | 1-1 | 100.0 | 4-4 | 100.0 | 11 |
| Nov 25 | at NAIT | L, 76-70 | 1 | 36 | 2-10 | 20.0 | 0-4 | 0.0 | 0-0 | - | 4 |
| Dec 28 | at Montana Tech | L, 96-63 | - | - | - | - | - | - | - | - | - |
| Dec 29 | at Carroll College | L, 97-64 | - | - | - | - | - | - | - | - | - |
| Dec 30 | at Montana State University-Northern | L, 72-64 | - | - | - | - | - | - | - | - | - |
| Jan 5 | Western Canada Prep Academy | L, 99-88 | - | - | - | - | - | - | - | - | - |
| Jan 6 | Western Canada Prep Academy | W, 93-53 | - | - | - | - | - | - | - | - | - |
| Jan 13 | at University of Alberta-Augustana | W, 81-74 | 1 | 30 | 3-9 | 33.3 | 0-3 | 0.0 | 1-2 | 50.0 | 7 |
| Jan 19 | Keyano College | L, 77-76 | 1 | 36 | 4-10 | 40.0 | 3-5 | 60.0 | 2-3 | 66.7 | 13 |
| Jan 20 | Keyano College | L, 91-84 | 1 | 29 | 3-9 | 33.3 | 1-3 | 33.3 | 1-2 | 50.0 | 8 |
| Feb 2 | at Northwestern Polytechnic | L, 66-52 | 1 | 34 | 3-13 | 23.1 | 1-4 | 25.0 | 0-0 | - | 7 |
| Feb 3 | at Northwestern Polytechnic | W, 80-70 | 1 | 33 | 8-15 | 53.3 | 2-4 | 50.0 | 3-4 | 75.0 | 21 |
| Feb 9 | at St. Mary's University | L, 105-78 | 1 | 29 | 7-14 | 50.0 | 3-6 | 50.0 | 0-1 | 0.0 | 17 |
| Feb 10 | vs. SAIT | L, 81-64 | 1 | 27 | 3-11 | 27.3 | 0-4 | 0.0 | 1-2 | 50.0 | 7 |
| Feb 16 | Red Deer Polytechnic | W, 84-78 | 1 | 20 | 2-9 | 22.2 | 1-3 | 33.3 | 1-2 | 50.0 | 6 |
| Feb 17 | Olds College | W, 108-77 | 1 | 31 | 11-17 | 64.7 | 1-4 | 25.0 | 2-2 | 100.0 | 25 |
Game Log - Ball control
| Date | Opponent | Score | gs | min | off | def | reb | ast | to | stl | blk |
|---|---|---|---|---|---|---|---|---|---|---|---|
| Sep 29 | Red Deer Polytechnic | L, 96-91 | - | - | - | - | - | - | - | - | - |
| Sep 30 | Red Deer Polytechnic | L, 102-89 | - | - | - | - | - | - | - | - | - |
| Oct 5 | Briercrest College | W, 87-77 | - | - | - | - | - | - | - | - | - |
| Oct 6 | Briercrest College | W, 75-72 | - | - | - | - | - | - | - | - | - |
| Oct 13 | Concordia University of Edmonton | L, 82-63 | 1 | 35 | 2 | 2 | 4 | 2 | 3 | 0 | 0 |
| Oct 14 | at Concordia University of Edmonton | L, 98-87 | 1 | 28 | 4 | 1 | 5 | 2 | 2 | 1 | 0 |
| Oct 27 | at The King's University | W, 85-77 | 1 | 25 | 1 | 1 | 2 | 0 | 1 | 1 | 0 |
| Oct 28 | The King's University | W, 87-80 | 1 | 24 | 0 | 2 | 2 | 1 | 1 | 1 | 0 |
| Nov 3 | Briercrest College | W, 91-88 | 1 | 38 | 4 | 7 | 11 | 3 | 2 | 2 | 0 |
| Nov 4 | Medicine Hat College | W, 95-93 | 1 | 33 | 0 | 5 | 5 | 5 | 1 | 2 | 1 |
| Nov 10 | University of Alberta-Augustana | W, 86-67 | 1 | 23 | 2 | 3 | 5 | 5 | 3 | 2 | 0 |
| Nov 17 | at Lethbridge College | W, 97-78 | 1 | 24 | 0 | 4 | 4 | 2 | 1 | 2 | 0 |
| Nov 18 | at Ambrose University | W, 92-70 | 1 | 26 | 1 | 6 | 7 | 1 | 1 | 2 | 1 |
| Nov 24 | NAIT | W, 91-65 | 1 | 32 | 1 | 7 | 8 | 3 | 3 | 3 | 0 |
| Nov 25 | at NAIT | L, 76-70 | 1 | 36 | 3 | 1 | 4 | 1 | 1 | 1 | 0 |
| Dec 28 | at Montana Tech | L, 96-63 | - | - | - | - | - | - | - | - | - |
| Dec 29 | at Carroll College | L, 97-64 | - | - | - | - | - | - | - | - | - |
| Dec 30 | at Montana State University-Northern | L, 72-64 | - | - | - | - | - | - | - | - | - |
| Jan 5 | Western Canada Prep Academy | L, 99-88 | - | - | - | - | - | - | - | - | - |
| Jan 6 | Western Canada Prep Academy | W, 93-53 | - | - | - | - | - | - | - | - | - |
| Jan 13 | at University of Alberta-Augustana | W, 81-74 | 1 | 30 | 1 | 5 | 6 | 2 | 4 | 0 | 0 |
| Jan 19 | Keyano College | L, 77-76 | 1 | 36 | 2 | 3 | 5 | 3 | 1 | 1 | 0 |
| Jan 20 | Keyano College | L, 91-84 | 1 | 29 | 3 | 1 | 4 | 4 | 2 | 1 | 0 |
| Feb 2 | at Northwestern Polytechnic | L, 66-52 | 1 | 34 | 1 | 5 | 6 | 1 | 5 | 4 | 0 |
| Feb 3 | at Northwestern Polytechnic | W, 80-70 | 1 | 33 | 1 | 4 | 5 | 3 | 3 | 5 | 0 |
| Feb 9 | at St. Mary's University | L, 105-78 | 1 | 29 | 2 | 3 | 5 | 1 | 2 | 0 | 0 |
| Feb 10 | vs. SAIT | L, 81-64 | 1 | 27 | 1 | 0 | 1 | 3 | 1 | 1 | 1 |
| Feb 16 | Red Deer Polytechnic | W, 84-78 | 1 | 20 | 2 | 3 | 5 | 2 | 0 | 1 | 0 |
| Feb 17 | Olds College | W, 108-77 | 1 | 31 | 3 | 1 | 4 | 5 | 0 | 1 | 0 |
Game Log - Ball control extended
| Date | Opponent | Score | gs | pf | dq | a/to |
|---|---|---|---|---|---|---|
| Sep 29 | Red Deer Polytechnic | L, 96-91 | - | - | - | - |
| Sep 30 | Red Deer Polytechnic | L, 102-89 | - | - | - | - |
| Oct 5 | Briercrest College | W, 87-77 | - | - | - | - |
| Oct 6 | Briercrest College | W, 75-72 | - | - | - | - |
| Oct 13 | Concordia University of Edmonton | L, 82-63 | 1 | 5 | 1 | 0.7 |
| Oct 14 | at Concordia University of Edmonton | L, 98-87 | 1 | 3 | - | 1.0 |
| Oct 27 | at The King's University | W, 85-77 | 1 | 2 | - | 0.0 |
| Oct 28 | The King's University | W, 87-80 | 1 | 3 | - | 1.0 |
| Nov 3 | Briercrest College | W, 91-88 | 1 | 2 | - | 1.5 |
| Nov 4 | Medicine Hat College | W, 95-93 | 1 | 4 | - | 5.0 |
| Nov 10 | University of Alberta-Augustana | W, 86-67 | 1 | 1 | - | 1.7 |
| Nov 17 | at Lethbridge College | W, 97-78 | 1 | 1 | - | 2.0 |
| Nov 18 | at Ambrose University | W, 92-70 | 1 | 5 | 1 | 1.0 |
| Nov 24 | NAIT | W, 91-65 | 1 | 0 | - | 1.0 |
| Nov 25 | at NAIT | L, 76-70 | 1 | 2 | - | 1.0 |
| Dec 28 | at Montana Tech | L, 96-63 | - | - | - | - |
| Dec 29 | at Carroll College | L, 97-64 | - | - | - | - |
| Dec 30 | at Montana State University-Northern | L, 72-64 | - | - | - | - |
| Jan 5 | Western Canada Prep Academy | L, 99-88 | - | - | - | - |
| Jan 6 | Western Canada Prep Academy | W, 93-53 | - | - | - | - |
| Jan 13 | at University of Alberta-Augustana | W, 81-74 | 1 | 3 | - | 0.5 |
| Jan 19 | Keyano College | L, 77-76 | 1 | 3 | - | 3.0 |
| Jan 20 | Keyano College | L, 91-84 | 1 | 2 | - | 2.0 |
| Feb 2 | at Northwestern Polytechnic | L, 66-52 | 1 | 2 | - | 0.2 |
| Feb 3 | at Northwestern Polytechnic | W, 80-70 | 1 | 2 | - | 1.0 |
| Feb 9 | at St. Mary's University | L, 105-78 | 1 | 1 | - | 0.5 |
| Feb 10 | vs. SAIT | L, 81-64 | 1 | 3 | - | 3.0 |
| Feb 16 | Red Deer Polytechnic | W, 84-78 | 1 | 4 | - | - |
| Feb 17 | Olds College | W, 108-77 | 1 | 2 | - | - |
Career Stats - Shooting per game
| gp | min/g | fg/g | 3pt/g | ft/g | ppg | |
|---|---|---|---|---|---|---|
| 2023-24 | 20 | 29.6 | 4.3-11.8 | 1.1-3.8 | 2.5-3.0 | 12.3 |
| Total | 20 | 29.6 | 4.3-11.8 | 1.1-3.8 | 2.5-3.0 | 12.3 |
Career Stats - Shooting totals
| gp | gs | min | fg | pct | 3pt | pct | ft | pct | pts | |
|---|---|---|---|---|---|---|---|---|---|---|
| 2023-24 | 20 | 20 | 593 | 87-237 | 36.7 | 22-76 | 28.9 | 49-61 | 80.3 | 245 |
| Total | 20 | 20 | 593 | 87-237 | 36.7 | 22-76 | 28.9 | 49-61 | 80.3 | 245 |
Career Stats - Shooting per 40 min
| gp | min | min/g | fg/40 | 3pt/40 | pct | ft/40 | pts/40 | |
|---|---|---|---|---|---|---|---|---|
| 2023-24 | 20 | 593 | 29.6 | 5.9-16.0 | 1.5-5.1 | 28.9 | 3.3-4.1 | 16.5 |
| Total | 20 | 593 | 29.6 | 5.9-16.0 | 1.5-5.1 | 28.9 | 3.3-4.1 | 16.5 |
Career Stats - Ball control per game
| gp | off/g | def/g | reb/g | ast/g | to/g | stl/g | blk/g | |
|---|---|---|---|---|---|---|---|---|
| 2023-24 | 20 | 1.7 | 3.2 | 4.9 | 2.5 | 1.9 | 1.6 | 0.1 |
| Total | 20 | 1.7 | 3.2 | 4.9 | 2.5 | 1.9 | 1.6 | 0.1 |
Career Stats - Ball control totals
| gp | gs | off | def | reb | ast | to | stl | blk | |
|---|---|---|---|---|---|---|---|---|---|
| 2023-24 | 20 | 20 | 34 | 64 | 98 | 49 | 37 | 31 | 3 |
| Total | 20 | 20 | 34 | 64 | 98 | 49 | 37 | 31 | 3 |
Career Stats - Ball control per 40 min
| gp | off/40 | def/40 | reb/40 | ast/40 | to/40 | stl/40 | blk/40 | |
|---|---|---|---|---|---|---|---|---|
| 2023-24 | 20 | 2.3 | 4.3 | 6.6 | 3.3 | 2.5 | 2.1 | 0.2 |
| Total | 20 | 2.3 | 4.3 | 6.6 | 3.3 | 2.5 | 2.1 | 0.2 |
Splits Stats - Shooting per game
| gp | min/g | fg/g | 3pt/g | ft/g | ppg | |
|---|---|---|---|---|---|---|
| Event | ||||||
| Total | 20 | 29.6 | 4.3-11.8 | 1.1-3.8 | 2.5-3.0 | 12.3 |
| Conference | 20 | 29.6 | 4.3-11.8 | 1.1-3.8 | 2.5-3.0 | 12.3 |
| Exhibition | - | - | 0.0-0.0 | 0.0-0.0 | 0.0-0.0 | - |
| Location | ||||||
| Home | 10 | 30.1 | 4.6-12.5 | 1.2-3.8 | 3.0-3.5 | 13.4 |
| Away | 9 | 29.4 | 4.2-11.2 | 1.1-3.8 | 2.0-2.7 | 11.6 |
| Neutral | 1 | 27.0 | 3.0-11.0 | 0.0-4.0 | 1.0-2.0 | 7.0 |
| Result | ||||||
| Wins | 12 | 28.3 | 4.8-11.6 | 0.9-3.2 | 3.0-3.7 | 13.4 |
| Losses | 8 | 31.8 | 3.8-12.2 | 1.4-4.8 | 1.6-2.1 | 10.5 |
| Month | ||||||
| October | 4 | 28.0 | 3.2-11.8 | 0.8-3.5 | 4.2-4.8 | 11.5 |
| November | 7 | 30.3 | 4.3-11.9 | 1.0-3.7 | 3.0-3.4 | 12.6 |
| January | 3 | 31.7 | 3.3-9.3 | 1.3-3.7 | 1.3-2.3 | 9.3 |
| February | 6 | 29.0 | 5.7-13.2 | 1.3-4.2 | 1.2-1.8 | 13.8 |
Splits Stats - Shooting totals
| gp | gs | min | fg | pct | 3pt | pct | ft | pct | pts | |
|---|---|---|---|---|---|---|---|---|---|---|
| Event | ||||||||||
| Total | 20 | 20 | 593 | 87-237 | 36.7 | 22-76 | 28.9 | 49-61 | 80.3 | 245 |
| Conference | 20 | 20 | 593 | 87-237 | 36.7 | 22-76 | 28.9 | 49-61 | 80.3 | 245 |
| Exhibition | - | - | - | 0-0 | - | 0-0 | - | 0-0 | - | 0 |
| Location | ||||||||||
| Home | 10 | 10 | 301 | 46-125 | 36.8 | 12-38 | 31.6 | 30-35 | 85.7 | 134 |
| Away | 9 | 9 | 265 | 38-101 | 37.6 | 10-34 | 29.4 | 18-24 | 75.0 | 104 |
| Neutral | 1 | 1 | 27 | 3-11 | 27.3 | 0-4 | 0.0 | 1-2 | 50.0 | 7 |
| Result | ||||||||||
| Wins | 12 | 12 | 339 | 57-139 | 41.0 | 11-38 | 28.9 | 36-44 | 81.8 | 161 |
| Losses | 8 | 8 | 254 | 30-98 | 30.6 | 11-38 | 28.9 | 13-17 | 76.5 | 84 |
| Month | ||||||||||
| October | 4 | 4 | 112 | 13-47 | 27.7 | 3-14 | 21.4 | 17-19 | 89.5 | 46 |
| November | 7 | 7 | 212 | 30-83 | 36.1 | 7-26 | 26.9 | 21-24 | 87.5 | 88 |
| January | 3 | 3 | 95 | 10-28 | 35.7 | 4-11 | 36.4 | 4-7 | 57.1 | 28 |
| February | 6 | 6 | 174 | 34-79 | 43.0 | 8-25 | 32.0 | 7-11 | 63.6 | 83 |
Splits Stats - Shooting per 40 min
| gp | min | min/g | fg/40 | 3pt/40 | pct | ft/40 | pts/40 | |
|---|---|---|---|---|---|---|---|---|
| Event | ||||||||
| Total | 20 | 593 | 29.6 | 5.9-16.0 | 1.5-5.1 | 28.9 | 3.3-4.1 | 16.5 |
| Conference | 20 | 593 | 29.6 | 5.9-16.0 | 1.5-5.1 | 28.9 | 3.3-4.1 | 16.5 |
| Exhibition | - | - | - | 0.0-0.0 | 0.0-0.0 | - | 0.0-0.0 | - |
| Location | ||||||||
| Home | 10 | 301 | 30.1 | 6.1-16.6 | 1.6-5.0 | 31.6 | 4.0-4.7 | 17.8 |
| Away | 9 | 265 | 29.4 | 5.7-15.2 | 1.5-5.1 | 29.4 | 2.7-3.6 | 15.7 |
| Neutral | 1 | 27 | 27.0 | 4.4-16.3 | 0.0-5.9 | 0.0 | 1.5-3.0 | 10.4 |
| Result | ||||||||
| Wins | 12 | 339 | 28.3 | 6.7-16.4 | 1.3-4.5 | 28.9 | 4.2-5.2 | 19.0 |
| Losses | 8 | 254 | 31.8 | 4.7-15.4 | 1.7-6.0 | 28.9 | 2.0-2.7 | 13.2 |
| Month | ||||||||
| October | 4 | 112 | 28.0 | 4.6-16.8 | 1.1-5.0 | 21.4 | 6.1-6.8 | 16.4 |
| November | 7 | 212 | 30.3 | 5.7-15.7 | 1.3-4.9 | 26.9 | 4.0-4.5 | 16.6 |
| January | 3 | 95 | 31.7 | 4.2-11.8 | 1.7-4.6 | 36.4 | 1.7-2.9 | 11.8 |
| February | 6 | 174 | 29.0 | 7.8-18.2 | 1.8-5.7 | 32.0 | 1.6-2.5 | 19.1 |
Splits Stats - Ball control per game
| gp | off/g | def/g | reb/g | ast/g | to/g | stl/g | blk/g | |
|---|---|---|---|---|---|---|---|---|
| Event | ||||||||
| Total | 20 | 1.7 | 3.2 | 4.9 | 2.5 | 1.9 | 1.6 | 0.1 |
| Conference | 20 | 1.7 | 3.2 | 4.9 | 2.5 | 1.9 | 1.6 | 0.1 |
| Exhibition | - | - | - | - | - | - | - | - |
| Location | ||||||||
| Home | 10 | 1.9 | 3.4 | 5.3 | 3.3 | 1.6 | 1.4 | 0.1 |
| Away | 9 | 1.6 | 3.3 | 4.9 | 1.4 | 2.2 | 1.8 | 0.1 |
| Neutral | 1 | 1.0 | 0.0 | 1.0 | 3.0 | 1.0 | 1.0 | 1.0 |
| Result | ||||||||
| Wins | 12 | 1.3 | 4.0 | 5.3 | 2.7 | 1.7 | 1.8 | 0.2 |
| Losses | 8 | 2.3 | 2.0 | 4.3 | 2.1 | 2.1 | 1.1 | 0.1 |
| Month | ||||||||
| October | 4 | 1.8 | 1.5 | 3.3 | 1.3 | 1.8 | 0.8 | 0.0 |
| November | 7 | 1.6 | 4.7 | 6.3 | 2.9 | 1.7 | 2.0 | 0.3 |
| January | 3 | 2.0 | 3.0 | 5.0 | 3.0 | 2.3 | 0.7 | 0.0 |
| February | 6 | 1.7 | 2.7 | 4.3 | 2.5 | 1.8 | 2.0 | 0.2 |
Splits Stats - Ball control totals
| gp | gs | off | def | reb | ast | to | stl | blk | |
|---|---|---|---|---|---|---|---|---|---|
| Event | |||||||||
| Total | 20 | 20 | 34 | 64 | 98 | 49 | 37 | 31 | 3 |
| Conference | 20 | 20 | 34 | 64 | 98 | 49 | 37 | 31 | 3 |
| Exhibition | - | - | - | - | - | - | - | - | - |
| Location | |||||||||
| Home | 10 | 10 | 19 | 34 | 53 | 33 | 16 | 14 | 1 |
| Away | 9 | 9 | 14 | 30 | 44 | 13 | 20 | 16 | 1 |
| Neutral | 1 | 1 | 1 | 0 | 1 | 3 | 1 | 1 | 1 |
| Result | |||||||||
| Wins | 12 | 12 | 16 | 48 | 64 | 32 | 20 | 22 | 2 |
| Losses | 8 | 8 | 18 | 16 | 34 | 17 | 17 | 9 | 1 |
| Month | |||||||||
| October | 4 | 4 | 7 | 6 | 13 | 5 | 7 | 3 | 0 |
| November | 7 | 7 | 11 | 33 | 44 | 20 | 12 | 14 | 2 |
| January | 3 | 3 | 6 | 9 | 15 | 9 | 7 | 2 | 0 |
| February | 6 | 6 | 10 | 16 | 26 | 15 | 11 | 12 | 1 |
Splits Stats - Ball control per 40 min
| gp | off/40 | def/40 | reb/40 | ast/40 | to/40 | stl/40 | blk/40 | |
|---|---|---|---|---|---|---|---|---|
| Event | ||||||||
| Total | 20 | 2.3 | 4.3 | 6.6 | 3.3 | 2.5 | 2.1 | 0.2 |
| Conference | 20 | 2.3 | 4.3 | 6.6 | 3.3 | 2.5 | 2.1 | 0.2 |
| Exhibition | - | - | - | - | - | - | - | - |
| Location | ||||||||
| Home | 10 | 2.5 | 4.5 | 7.0 | 4.4 | 2.1 | 1.9 | 0.1 |
| Away | 9 | 2.1 | 4.5 | 6.6 | 2.0 | 3.0 | 2.4 | 0.2 |
| Neutral | 1 | 1.5 | 0.0 | 1.5 | 4.4 | 1.5 | 1.5 | 1.5 |
| Result | ||||||||
| Wins | 12 | 1.9 | 5.7 | 7.6 | 3.8 | 2.4 | 2.6 | 0.2 |
| Losses | 8 | 2.8 | 2.5 | 5.4 | 2.7 | 2.7 | 1.4 | 0.2 |
| Month | ||||||||
| October | 4 | 2.5 | 2.1 | 4.6 | 1.8 | 2.5 | 1.1 | 0.0 |
| November | 7 | 2.1 | 6.2 | 8.3 | 3.8 | 2.3 | 2.6 | 0.4 |
| January | 3 | 2.5 | 3.8 | 6.3 | 3.8 | 2.9 | 0.8 | 0.0 |
| February | 6 | 2.3 | 3.7 | 6.0 | 3.4 | 2.5 | 2.8 | 0.2 |
News Mentions
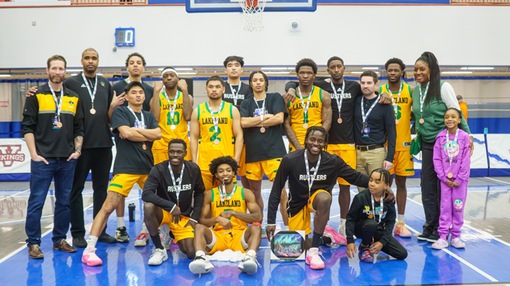
Rustlers MBB end the season with a bronze
March 6, 2024